
Published · Updated
explaining financial leverageExplaining financial leverage for property investors
By James Dawes, CeMAP, Founder, James William & Co Capital

TL;DR:
- Financial leverage involves using borrowed funds to amplify potential investment returns while increasing the risk of losses. It is measured primarily by the debt-to-equity ratio and the debt service coverage ratio, which inform sustainable capital structures. Managing leverage carefully through stress testing and active monitoring is crucial to mitigate risks and optimize property investment outcomes.
Financial leverage is defined as the use of borrowed capital to increase the potential return on an investment, while simultaneously raising the risk of loss if that investment underperforms. For property investors and financial professionals structuring capital, understanding this mechanism is not optional. It determines how much you can acquire, what returns you can generate, and how exposed you are when markets tighten. This article covers the financial leverage definition, how it is measured, how it differs from operating leverage, and how to apply that knowledge to real capital structure decisions in UK property.
Explaining financial leverage: definition and core mechanics
Financial leverage, in formal terms, refers to the practice of using borrowed funds) to buy or finance investments, magnifying returns when investments perform well but increasing the risk of repayment failure when they do not. The industry standard term is simply “financial leverage,” and it sits at the heart of every property acquisition, development finance deal, and refinance a professional investor will ever execute.
The core mechanic is straightforward. You invest £1,000,000 of equity into a property worth £4,000,000, borrowing the remaining £3,000,000. If the asset rises 10% in value, your equity gain is £400,000 on a £1,000,000 outlay. That is a 40% return on equity, not 10%. The debt has amplified your result. The same logic works in reverse. A 10% fall in asset value wipes out 40% of your equity position.

This amplification effect explains why lenders do not simply hand over capital without conditions. Lenders impose limits) and require collateral because leverage magnifies risk and potential losses on both sides of the transaction. Understanding this dynamic is the starting point for every informed capital structure decision.
How is financial leverage calculated?
Several metrics quantify financial leverage, and each tells a different part of the story. The most widely used is the debt-to-equity (D/E) ratio.
Debt-to-equity ratio
The D/E ratio is calculated by dividing total liabilities by shareholders’ equity. A ratio of 3.0 means the business or project carries £3 of debt for every £1 of equity. Higher D/E values indicate greater reliance on debt and higher vulnerability during downturns. The ratio is not absolute. A D/E of 3.0 may be entirely normal in commercial real estate development and alarming in a retail business with volatile revenues.
Degree of financial leverage
The Degree of Financial Leverage (DFL) is a more precise tool. It quantifies the sensitivity of earnings per share) (EPS) to changes in earnings before interest and taxes (EBIT). A DFL of 2.0 means a 10% change in EBIT produces a 20% change in EPS. This matters enormously when you are stress testing a development project against rental voids or construction cost overruns.
Accounting leverage vs economic leverage
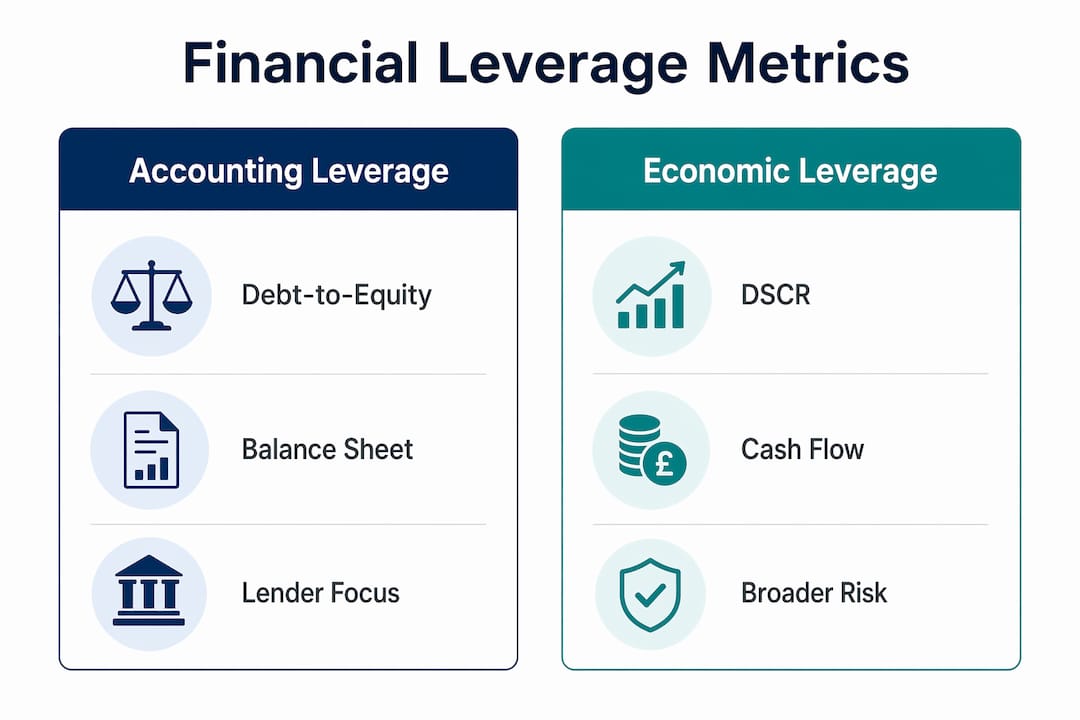
Accounting leverage uses balance sheet data) exclusively. Economic leverage goes further, incorporating off-balance-sheet instruments and contingent liabilities that affect true risk exposure. For sophisticated investors using mezzanine debt, preferred equity, or joint venture structures, the economic picture often diverges significantly from what the balance sheet shows.
| Metric | What It Measures | Primary Use |
|---|---|---|
| Debt-to-Equity (D/E) | Debt relative to equity | Capital structure assessment |
| Degree of Financial Leverage (DFL) | EPS sensitivity to EBIT changes | Earnings volatility analysis |
| Loan-to-Value (LTV) | Debt relative to asset value | Property lending decisions |
| Interest Coverage Ratio | EBIT relative to interest expense | Debt serviceability check |
| Debt Service Coverage Ratio (DSCR) | Net operating income vs debt payments | Cash flow stress testing |
Pro Tip: When reviewing a deal’s leverage profile, always calculate both the D/E ratio and the DSCR. The D/E tells you the structural position; the DSCR tells you whether the cash flow can actually survive a stress event.
What are the risks and benefits of financial leverage in property?
Financial leverage in property investment is genuinely a double-edged instrument. The benefits are real and substantial. So are the risks. Neither side of this equation should be underweighted.
The benefits
- Return amplification. Borrowing at 6% to acquire an asset yielding 9% generates a positive carry. The spread between cost of debt and asset return accrues entirely to equity holders.
- Portfolio scale. Leverage allows investors to control a larger asset base with a fixed equity pool, spreading risk across multiple assets rather than concentrating it in one.
- Tax efficiency. In many UK property structures, interest costs are deductible against income, reducing the effective cost of debt capital.
- Equity preservation. Retaining equity for future opportunities rather than deploying it all into a single asset is a legitimate capital allocation strategy.
The risks
- Fixed obligations. Debt requires fixed interest payments even when revenues decline. A void period on a leveraged commercial asset does not pause the interest clock.
- Solvency exposure. High leverage increases the probability of financial distress if asset values fall or income drops. The 2008 financial crisis demonstrated this at scale across UK commercial property.
- Lender constraints. Lenders limit leverage aggressively) and require collateral, which restricts available capital and can force asset sales at inopportune moments.
- Refinancing risk. A deal structured at peak leverage in a low-rate environment may face a covenant breach or forced deleveraging when rates rise or lender appetite shifts.
Pro Tip: Always model your debt service under a scenario where rental income falls 20% and interest rates rise 200 basis points simultaneously. If the project cannot survive that stress, the leverage is too high regardless of what the base case shows.
For a deeper look at how debt financing trade-offs play out in UK acquisitions, the analysis on real estate debt in UK property is worth reviewing before committing to a capital structure.
How does financial leverage differ from operating leverage?
Operating leverage and financial leverage are related but distinct concepts. Conflating them leads to systematic underestimation of total business risk.
Operating leverage relates to fixed versus variable costs and determines how sensitive a business’s profits are to changes in revenue. A property developer with high fixed overheads, long build programmes, and fixed site costs has high operating leverage. A small revenue shortfall produces a disproportionately large profit reduction.
Financial leverage, by contrast, relates to debt and solvency risk. It affects how earnings translate into returns for equity holders after interest obligations are met.
The combined effect is what professionals call “total leverage.” Consider this sequence:
- A development company has high fixed construction costs, creating high operating leverage.
- The same company finances the development with 70% senior debt and 20% mezzanine, creating high financial leverage.
- A 15% reduction in end values compresses operating profit sharply due to fixed costs.
- That compressed profit then has to service a large debt stack, potentially triggering covenant breaches.
- The combined leverage effect turns a manageable market correction into a solvency event.
| Leverage Type | Driver | Key Risk | Measured By |
|---|---|---|---|
| Operating Leverage | Fixed vs variable costs | Profit sensitivity to revenue | Contribution margin ratio |
| Financial Leverage | Debt vs equity | Solvency and interest burden | D/E ratio, DFL |
| Combined Leverage | Both simultaneously | Amplified earnings volatility | Degree of Total Leverage (DTL) |
Understanding both types is critical for assessing the combined impact on business risk, particularly in ground-up development where both operating and financial leverage tend to be elevated simultaneously.
How should investors apply leverage knowledge to capital structure decisions?
Knowing the theory is one thing. Applying it to live transactions is where financial leverage understanding actually creates value. The following principles guide sound capital structure decisions in UK property investment.
- Contextualise your D/E ratio. A high D/E ratio may signal overleverage and financial distress risk, while too low a ratio could indicate missed growth opportunities. Benchmark against sector norms and your specific asset class before drawing conclusions.
- Prioritise cash flow coverage over balance sheet optics. The critical question in property investment is whether operating cash flow can cover fixed debt service under stress, not just what the D/E ratio looks like on paper. A DSCR calculator, such as the one available via Platinum Capital Advisors, can help model this quickly across multiple scenarios.
- Account for lender mechanics. Lenders’ leverage limits and collateral requirements translate into practical constraints that do not always align with the theoretical maximum leverage from an equity return perspective. Your optimal leverage and the lender’s maximum leverage are rarely the same number.
- Stress test across rate and income scenarios. Model debt service under rising rates, extended void periods, and cost overruns. If the project fails under any plausible stress scenario, the capital structure needs adjustment before drawdown.
- Monitor leverage ratios actively post-completion. Leverage is not a static figure. Asset values shift, income changes, and debt amortises. Reviewing your D/E and interest coverage ratios quarterly allows you to act before a covenant breach rather than after.
- Consider the full debt stack. In complex transactions involving senior debt, mezzanine, and preferred equity, economic leverage often exceeds what accounting metrics capture. Model the full waterfall, not just the senior facility.
For investors looking to understand how to structure borrowing across multiple funding layers, the guide on optimising real estate funding covers the practical mechanics in detail.
Key takeaways
Financial leverage amplifies both returns and losses, making cash flow stress testing and contextual ratio analysis the two non-negotiable disciplines for any investor using debt in property.
| Point | Details |
|---|---|
| Core definition | Financial leverage uses borrowed capital to amplify investment returns and losses simultaneously. |
| Primary metric | The debt-to-equity ratio measures leverage but must be interpreted within sector and deal context. |
| Cash flow primacy | DSCR and cash flow coverage matter more than balance sheet ratios for property debt decisions. |
| Operating vs financial leverage | Both types compound in development deals, creating total leverage risk that exceeds either measure alone. |
| Lender constraints | Lender-imposed limits and collateral requirements set the practical ceiling on available leverage, not theory. |
Where most investors get leverage wrong
I have structured debt across hundreds of UK property transactions, from straightforward buy-to-let refinances to multi-tranche development stacks involving offshore vehicles and mezzanine providers. The single most common error I see is treating leverage as a static input rather than a dynamic risk variable.
Investors spend considerable time negotiating the initial loan-to-value and then file the leverage analysis away. Six months into a development, construction costs have risen, the programme has slipped, and the interest reserve is being consumed faster than projected. The leverage position has materially worsened, but nobody has updated the model.
The second error is conflating accounting leverage with economic leverage. A deal can look conservatively structured on paper while carrying significant off-balance-sheet exposure through personal guarantees, cross-collateralisation, or deferred land payments. I have seen transactions where the headline LTV was 65% but the true economic exposure to the equity holder was closer to 90% once all contingent liabilities were mapped.
UK property markets in 2026 are operating in an environment where lender appetite is more selective than it was in 2021. Covenant packages are tighter, and lenders are scrutinising DSCR projections with considerably more rigour. That is not a reason to avoid leverage. It is a reason to use it with precision. The investors who perform consistently are those who understand their leverage position at every stage of a deal, not just at origination.
— James
Structure your next deal with james william & co

James William & Co specialises in arranging sophisticated property finance for investors, developers, and high-net-worth clients across the UK. Whether you are structuring a multi-tranche development facility, refinancing a commercial portfolio, or assessing the right debt-to-equity position for a large-scale acquisition, the firm’s capital concierge approach gives you a single point of contact for end-to-end structuring and execution. James William & Co works with family offices, private credit funds, and specialist lenders to deliver tailored solutions at speed. Explore the firm’s specialist property finance services and find out how bespoke debt structuring can work for your next transaction.
FAQ
What is the financial leverage definition in simple terms?
Financial leverage is the use of borrowed money to increase the potential return on an investment. It amplifies both gains and losses relative to the equity invested.
How does financial leverage work in property investment?
A property investor borrows a proportion of the purchase price, using debt to control a larger asset than equity alone would allow. Returns on equity are magnified when asset values rise, but losses are equally amplified when values fall or income drops.
What is a good debt-to-equity ratio for property investors?
There is no universal answer. A D/E ratio that is appropriate depends on asset class, income stability, and lender appetite. In UK commercial property development, ratios of 2.0–4.0 are common, but cash flow coverage of debt service is the more reliable indicator of sustainable leverage.
What is the difference between financial leverage and operating leverage?
Operating leverage relates to fixed versus variable costs and affects profit sensitivity to revenue changes. Financial leverage relates to debt and affects how earnings translate into equity returns after interest is paid. Both compound in development deals to create total leverage risk.
Why do lenders impose leverage limits on property loans?
Lenders restrict leverage because borrowed capital magnifies losses as well as gains. If an asset value falls sharply, a highly leveraged borrower may be unable to repay the full loan. Collateral requirements and loan covenants protect the lender’s position under stress scenarios.
Recommended
Related Topics
Speak to a specialist
Discuss your finance with James directly
Whole-of-market specialist finance — bridging, development, commercial and residential. No call centres, no obligation. James reviews every enquiry personally.
New to specialist finance? How unbiased broker advice works · Deals we have completed
Explore Related Finance