
Published · Updated
explaining irr in real estateExplaining IRR in real estate: a practical guide
By James Dawes, CeMAP, Founder, James William & Co Capital

TL;DR:
- Internal Rate of Return (IRR) is a key metric in real estate investing, quantifying how quickly investments generate returns by measuring the discount rate that zeroes out all cash flows. Accurate IRR calculation requires a detailed cash flow schedule, with XIRR in Excel preferred for its date-specific precision, especially when capital events occur outside standard intervals. To assess deal performance properly, investors should analyze both levered and unlevered IRRs alongside equity multiples and cash-on-cash returns, while considering the assumptions and limitations inherent in IRR models.
Internal Rate of Return (IRR) is defined as the annualised discount rate at which the net present value of all investment cash flows equals zero, making it the single most important efficiency metric in real estate investment analysis. Explaining IRR in real estate requires understanding that it captures not just how much money you make, but how quickly you make it. A deal returning £2m over three years is fundamentally different from one returning the same amount over ten, and IRR is the metric that quantifies that difference. Alongside equity multiple and cash-on-cash return, IRR forms the core of any credible real estate investment return analysis.
How is IRR calculated for real estate investments?
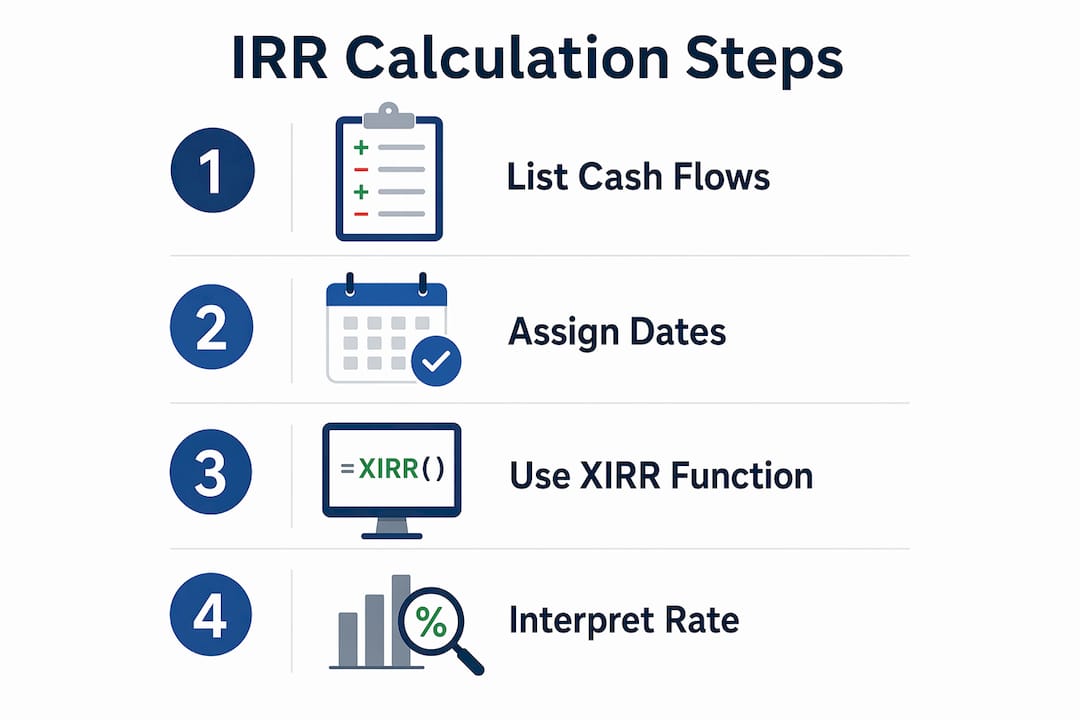
IRR captures the timing and magnitude of every cash flow across the full life of a deal, from initial equity outlay through to sale proceeds. To calculate it accurately, you must first construct a complete cash flow schedule. That means accounting for every pound in and every pound out, at the correct point in time.
The cash flows you need to model for a standard UK property investment are:
- Initial equity investment (negative cash flow at acquisition, Year 0)
- Net Operating Income (NOI) less reserves across each holding period year
- Capital expenditure (CapEx) as a separate negative cash flow, not netted against income
- Debt service (interest and principal repayments) if calculating levered IRR
- Refinance proceeds received mid-hold, if applicable
- Net sale proceeds at exit, after repaying outstanding debt and transaction costs
Once you have this schedule, IRR is the rate r that satisfies the net present value equation: the sum of each cash flow divided by (1 + r) to the power of the relevant period equals zero. There is no closed-form algebraic solution to this equation, which is why numerical iteration is required. In practice, Excel and Google Sheets handle this automatically.
Excel offers two functions: IRR and XIRR. For most real estate deals, XIRR is preferred because it accounts for the exact dates between cash flows rather than assuming equal annual intervals. A refinance event in month 19 or a delayed acquisition in February will produce a materially different result in XIRR versus the standard IRR function.
Pro Tip: Always use XIRR in Excel or Google Sheets for property deals. Input your actual transaction dates alongside each cash flow, and the function will calculate a date-precise annualised return. This matters most when capital events such as refinances or phased equity drawdowns fall outside standard year-end intervals.
What are levered vs. unlevered IRR and why do they matter?
The distinction between levered and unlevered IRR is one of the most misunderstood areas in real estate finance, and getting it wrong leads to poor capital allocation decisions.

Unlevered IRR measures the return on the property itself, before any debt is introduced. It treats the full acquisition price as the equity invested and models cash flows from NOI and sale proceeds without deducting debt service. This is a property-level metric, useful for comparing assets on a like-for-like basis regardless of how they are financed.
Levered IRR measures the return on your actual equity contribution after debt service. Levered IRR is typically higher than unlevered IRR when the property’s return exceeds the cost of debt, because leverage amplifies the return on a smaller equity base. A property generating an 8% unlevered IRR, financed at 5% interest, will produce a levered IRR well above 8% depending on the loan-to-value ratio and hold period.
| Metric | What it measures | When to use it |
|---|---|---|
| Unlevered IRR | Property-level return before debt | Comparing assets across different capital structures |
| Levered IRR | Equity-level return after debt service | Assessing actual investor return given financing terms |
The practical risk here is that sponsors frequently present only levered IRR in investment memoranda because it looks more attractive. Investors should always request both figures to properly assess whether returns are driven by asset quality or simply by aggressive leverage. A deal with a 20% levered IRR built on 80% LTV debt carries a very different risk profile from one achieving the same return at 50% LTV. Understanding LTV effects on returns is therefore inseparable from interpreting levered IRR correctly.
How does IRR compare with other real estate metrics?
IRR does not operate in isolation. The importance of IRR in investing is best understood when you place it alongside equity multiple and cash-on-cash return, each of which answers a different question about the same deal.
- Equity multiple tells you the total cash returned relative to capital invested. A 2.0x equity multiple means you doubled your money, regardless of how long it took.
- Cash-on-cash return measures the annual cash yield on invested equity from operating distributions alone, excluding appreciation or refinance proceeds. It is a current income metric.
- IRR measures efficiency. It tells you the annualised rate at which your capital is working, weighted by timing.
The critical insight is that a 2.0x equity multiple over 3 years produces a materially higher IRR than the same multiple achieved over 10 years. Two deals can show identical equity multiples and look equivalent on paper, yet one is far superior because it returns capital faster. IRR is the metric that surfaces this difference.
Cap rate, by contrast, is a static snapshot of a property’s income yield at a single point in time. It tells you nothing about hold period, capital growth, or the timing of distributions. Using cap rate alone to evaluate a value-add acquisition is like judging a marathon runner by their pace in the first mile.
Pro Tip: When evaluating any deal, run all three metrics together. A high IRR with a low equity multiple often signals a short hold with limited total profit. A high equity multiple with a low IRR suggests capital is tied up for a long time. The combination tells the full story.
Pairing IRR with equity multiple and cash-on-cash gives you a complete picture of return efficiency, total wealth creation, and current income yield simultaneously.
What assumptions and limitations affect IRR analyses?
IRR is a powerful metric, but it carries embedded assumptions that can distort results if left unexamined.
- Reinvestment risk. IRR assumes all interim cash flows are reinvested at the same IRR rate throughout the hold period. In practice, quarterly distributions from a stabilised asset are more likely reinvested at a lower market rate. This means IRR can overstate the true compound return on your capital.
- CapEx treatment. Capital expenditure must be deducted as a cash outflow in your IRR model. Sponsors who net CapEx against NOI or omit it entirely will present an inflated IRR. Always check the pro forma for explicit CapEx line items.
- Timing sensitivity. A small change in exit date or sale price has a disproportionate impact on IRR. A deal modelled to exit in Year 5 at a 5.0% cap rate will show a very different IRR if the exit slips to Year 7 or the market softens.
- Risk omission. IRR says nothing about the probability of achieving the projected cash flows. Two deals with identical IRRs can carry vastly different risk profiles depending on asset class, tenant covenant, planning risk, or UK property finance structure.
Modified IRR (MIRR) addresses the reinvestment assumption by allowing you to specify a separate, realistic reinvestment rate for interim cash flows. For deals with significant mid-hold distributions, MIRR produces a more conservative and arguably more honest return figure.
Transparency in IRR presentation is non-negotiable. Before committing capital, ask the sponsor to confirm whether the IRR shown is levered or unlevered, how CapEx has been treated, and what exit assumptions underpin the sale proceeds.
How can real estate investors use IRR effectively in 2026?
Knowing how to calculate IRR in real estate is only half the task. The other half is knowing what number to target and how to use it in decision-making.
Typical IRR targets in 2026 vary by asset class and risk profile:
| Asset class | Target IRR range | Notes |
|---|---|---|
| Residential buy-to-let | 5–10% | Lower leverage, stable income |
| Commercial property | 8–15% | Higher risk, longer leases |
| Value-add or development | 15–25%+ | Execution risk, planning exposure |
| Mezzanine or preferred equity | 12–18% | Fixed return profile, subordinated position |
These ranges reflect current UK market conditions, where property finance trends in 2026 include elevated base rates and tighter senior debt availability, both of which compress levered returns relative to the 2020 to 2022 cycle.
To use IRR effectively, apply it as a comparative tool across competing opportunities rather than as an absolute threshold. A 14% IRR on a well-let Manchester office block with a strong tenant covenant is a different proposition from 14% on a speculative ground-up scheme in a secondary market. IRR is the starting point for comparison, not the conclusion.
Hold period optimisation is another practical application. Modelling IRR at Year 3, Year 5, and Year 7 exit scenarios on the same asset often reveals a clear inflection point where the marginal benefit of holding longer no longer compensates for the reduction in annualised return. This analysis is straightforward in Excel using XIRR across multiple scenario columns. For UK investors assessing real estate funding sources and capital structures, running this sensitivity analysis before committing to a debt structure is standard practice at the institutional level.
Key takeaways
IRR is the definitive efficiency metric for real estate investment, but it only delivers reliable insight when calculated correctly, interpreted alongside equity multiple and cash-on-cash return, and stress-tested against realistic assumptions.
| Point | Details |
|---|---|
| IRR definition | IRR is the annualised discount rate making the net present value of all deal cash flows equal zero. |
| Use XIRR in Excel | XIRR accounts for exact cash flow dates, producing more accurate results than the standard IRR function. |
| Levered vs. unlevered | Always request both figures; levered IRR reflects financing risk, unlevered reflects asset quality. |
| Pair with other metrics | Combine IRR with equity multiple and cash-on-cash to assess efficiency, total profit, and income yield together. |
| Watch the assumptions | Reinvestment risk and CapEx treatment are the two most common sources of IRR inflation in sponsor models. |
IRR in practice: what I have learned from structuring complex UK deals
IRR is the metric I return to most consistently when evaluating a deal, but I have also seen it misused more than any other figure in property finance. The most common error is not a calculation mistake. It is a framing one. Sponsors present a 22% levered IRR, investors see a strong number, and nobody asks what leverage ratio produced it or whether the exit assumption is credible.
The second issue I encounter regularly is the reinvestment assumption. On a five-year value-add deal with quarterly distributions, the IRR calculation implicitly assumes those distributions are reinvested at the same 18% or 20% rate. That is almost never achievable in practice. When I run MIRR alongside IRR on the same model, using a realistic 6% to 8% reinvestment rate, the adjusted return is often 3 to 5 percentage points lower. That gap matters when you are allocating capital across a portfolio.
My recommendation is to treat IRR as a lens rather than a verdict. It is an efficiency metric rewarding earlier returns due to the time value of money, and that makes it genuinely useful for comparing opportunities with different hold periods and cash flow profiles. But it needs to sit alongside equity multiple, cash-on-cash, and a clear-eyed view of the assumptions baked into the model. The investors I work with who make the best decisions are the ones who ask for all three metrics and then interrogate the assumptions behind each one.
— James
Structure your next deal with James William & Co

Understanding IRR is one thing. Structuring a deal that actually achieves your target return is another. James William & Co works with UK property investors, developers, and high-net-worth clients to arrange finance that optimises capital efficiency across the full deal lifecycle. From senior debt and mezzanine to JV equity and complex refinances, the firm’s capital concierge approach means you have a single point of contact for every layer of the stack. If you are working on a transaction where specialist property finance in London or across the UK is required, James William & Co structures solutions that align with your IRR targets from day one. Explore the firm’s full property finance services or review recent case studies to see how deals have been executed under pressure.
FAQ
What does IRR mean in real estate?
IRR, or Internal Rate of Return, is the annualised discount rate at which the net present value of all investment cash flows equals zero. It measures how efficiently and quickly a real estate investment generates returns over its holding period.
What is a good IRR for a UK property investment?
Target IRR ranges in 2026 are 5 to 10% for residential assets and 8 to 15% for commercial property. Value-add and development deals typically target 15% or above to compensate for execution and planning risk.
What is the difference between levered and unlevered IRR?
Unlevered IRR measures the return on the property before debt, while levered IRR reflects equity returns after debt service. Levered IRR is higher when the property return exceeds the cost of borrowing.
Why is XIRR better than IRR for property deals?
The standard IRR function assumes equal time intervals between cash flows. XIRR uses exact dates, making it far more accurate for real estate transactions where refinances, distributions, and capital events rarely fall on year-end boundaries.
Can IRR be misleading in real estate analysis?
Yes. IRR assumes interim cash flows are reinvested at the same rate, which is rarely achievable. It also omits risk entirely. Always pair IRR with equity multiple and cash-on-cash return, and scrutinise the exit and CapEx assumptions in any sponsor model.
Recommended
Related Topics
Speak to a specialist
Discuss your finance with James directly
Whole-of-market specialist finance — bridging, development, commercial and residential. No call centres, no obligation. James reviews every enquiry personally.
New to specialist finance? How unbiased broker advice works · Deals we have completed
Explore Related Finance