
Published
what is tail riskTail risk: what it means and how to manage it
By James Dawes, CeMAP, Founder, James William & Co Capital

Tail risk is the danger that a portfolio suffers a loss far larger than standard models predict, an extreme event sitting in the left tail of the return distribution. It matters because these are precisely the losses that break capital preservation plans, and they happen more often than the neat symmetry of a normal distribution suggests. SKEW, a Cboe index designed to flag the market’s own pricing of these risks, typically hovers in territory implying meaningful probability of a two standard deviation move, well before you get anywhere near the three standard deviation events that most people associate with genuine tail risk.
Here’s the immediate practical point: tail risk can destroy capital in a way average volatility never will, and treating it seriously means accepting an ongoing cost. Insurance against rare disasters is never free. Firms like James William & Co Capital that structure debt and equity for property investors see this constantly. A well-underwritten deal can still be wrecked by a systemic shock nobody priced in.
Three things follow from that definition, and they set up everything else in this guide:
- Tail risk is about the shape of the loss distribution, not its average. A portfolio can look calm for years and still carry serious tail exposure.
- Managing it requires sizing rules decided in advance, not panic decisions made mid-crisis.
- Hedging tail risk almost always costs money in normal markets. The question is never “is it free” but “is the protection worth what you pay”.
Fast fact: Investopedia notes that during periods of market stress, correlations between assets tend to rise sharply, which is exactly when diversification is supposed to be doing its job and instead does the opposite.
Key Takeaways
Tail risk is manageable, not avoidable: it requires honest measurement, sized and governed hedges, and acceptance of ongoing cost as the price of genuine protection.
| Point | Details |
|---|---|
| Tail risk is a left-tail problem | Focus on rare, extreme losses beyond three standard deviations, not average volatility. |
| VaR alone understates danger | Pair Value at Risk with Expected Shortfall, EVT, or stress testing to see beyond the threshold. |
| Correlations spike in a crisis | Diversification weakens exactly when portfolios need it most, as seen in 2008 and 2020. |
| Hedging always carries a cost | Options, volatility instruments, and fund-based hedges all involve recurring drag in calm markets. |
| Governance decides long-term value | James William & Co Capital advises embedding hedge sizing and rebalancing rules into formal mandates, not ad hoc decisions. |
Table of Contents
- What is tail risk and why does it matter to investors?
- Why tail risk exists and how it differs from ordinary volatility
- How do you measure tail risk in practice?
- What historical events reveal about tail risk
- What are the main tail-risk hedging strategies?
- What does a tail-risk fund actually do?
- How much tail-risk hedging should a portfolio carry?
- What does tail-risk hedging actually cost?
- Why hedges should enable risk, not just reduce it
- How James William & Co Capital supports tail-risk planning
- Sources
- FAQ
What is tail risk and why does it matter to investors?
Tail risk describes rare, extreme outcomes at the edges of a return distribution, and in practice almost everyone means the left tail: catastrophic losses rather than freak gains. Wikipedia’s definition frames it as events lying far outside what a normal distribution would predict, often benchmarked at moves beyond three standard deviations. That threshold sounds academic until you remember that a three standard deviation equity drawdown, under a normal distribution assumption, should barely ever happen. Real markets produce them with uncomfortable regularity.
Why the near-exclusive focus on the downside? Because a catastrophic loss threatens solvency in a way an equivalent gain never threatens anything. An investor who misses out on an unusually good year is disappointed. An investor who gets wiped out by a systemic crash is finished. That asymmetry is why professional risk managers spend disproportionate energy on the left tail and comparatively little on modelling extreme upside.
For property developers and investors working with debt finance, this isn’t an abstract concern; understanding property investment risks is critical to managing tail exposures effectively. A leveraged position amplifies both the ordinary volatility of an asset and its tail exposure. If you’re financing a large-scale acquisition or a ground-up development, the loan structure itself can determine whether a market shock is survivable or fatal, a point worth reading in more detail in this piece on real estate debt in UK property.
Why tail risk exists and how it differs from ordinary volatility
Standard risk models, the kind most spreadsheets and off-the-shelf portfolio tools still lean on, assume returns follow something close to a normal distribution. That assumption is convenient and wrong. Real-world returns exhibit fat tails and excess kurtosis, statistical jargon for a simple idea: extreme outcomes cluster at the edges of the distribution far more than a bell curve implies.
Skewness compounds the problem. Many return series are not symmetric. Equity markets in particular show negative skew, meaning the worst losses tend to be sharper and more sudden than the best gains are smooth and gradual. PIMCO describes tails as literally the far ends of a distribution curve, and its own practitioner guidance is built around the idea that allocation decisions alone rarely capture this asymmetry properly, which is why it recommends layering in complementary hedges.
The second driver is correlation breakdown. Diversification works on the premise that different assets move somewhat independently, smoothing out the bumps. During genuine stress, that premise fails. Investopedia’s analysis points out that correlations between asset classes tend to rise sharply in a crisis, precisely when you need them to stay low. Equities, credit, and even supposedly uncorrelated alternatives can all fall together, because the underlying driver of the sell-off, usually a liquidity or solvency panic, touches everything at once.
A concrete way to picture this: a normal distribution would suggest that a move beyond three standard deviations happens only a handful of times per several thousand trading days. Markets have produced multiple such moves within single decades, sometimes within single years. That gap between model and reality is the entire reason tail-risk management exists as a discipline.
- Fat tails mean extreme losses cluster more than symmetric models predict.
- Negative skew means downside moves are often sharper than upside moves.
- Correlation spikes during stress erode the protection diversification normally provides.
- Kurtosis, the statistical measure of “tailedness”, tends to run higher in equity and credit markets than standard models assume.
How do you measure tail risk in practice?
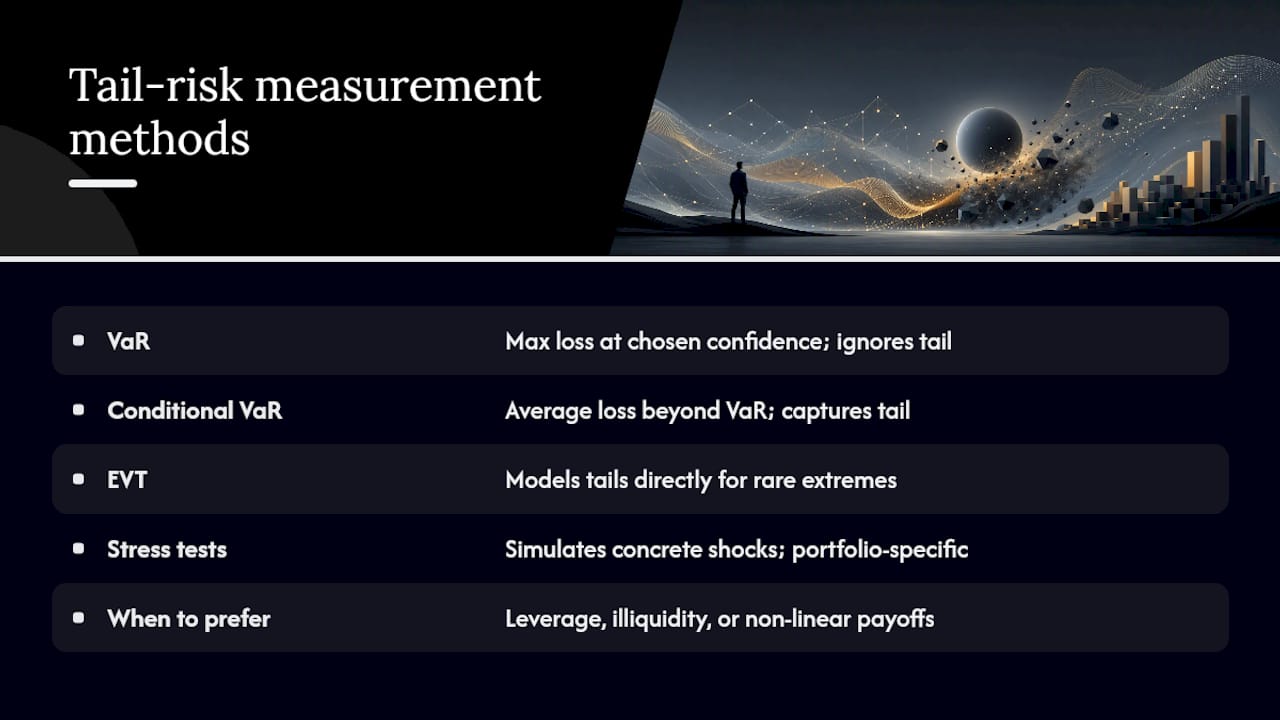
Value at Risk, or VaR, is the most widely used tail-risk metric, and it is also the most widely misunderstood. VaR gives you a single number: the maximum loss you’d expect not to exceed over a given period, at a chosen confidence level, say 95% or 99%. The catch is what VaR doesn’t tell you. It says nothing about how bad things get once you’re past that threshold. A 99% VaR figure treats a 1% loss and a catastrophic wipeout identically, because it only measures the boundary, not what lies beyond it.
Conditional Value at Risk, often called Expected Shortfall, fixes part of that blind spot by averaging the losses that occur beyond the VaR threshold. It’s a better number for tail-focused risk management because it actually engages with the shape of the bad outcomes rather than just their frequency. Neither metric, though, escapes the core problem of parameter estimation: both depend on historical data and distributional assumptions that may simply not hold during the next crisis.
Extreme-value theory, or EVT, takes a different approach. Rather than modelling the whole distribution and hoping the tails behave, EVT models the tails directly, using statistical techniques built specifically for rare, extreme observations. Academic research on tail behaviour supports the case that markets exhibit genuine excess kurtosis, lending weight to EVT-style approaches over naive parametric ones. Stress testing and scenario analysis complement this by asking a more concrete question: what happens to this specific portfolio if rates spike two percentage points, property values fall 20%, and liquidity dries up simultaneously? That’s less elegant mathematically but often more useful practically.
Model risk runs through all of it. Parameters estimated from a calm decade tell you little about a crisis decade. Non-stationarity, the tendency of market behaviour to change regime, means yesterday’s calibration can be actively misleading today. Path dependence matters too: a portfolio’s response to a shock depends heavily on the sequence of events, not just the final numbers.
Pro Tip: Don’t stop at the headline VaR figure on a risk report. Ask to see the underlying stress scenarios and their specific payoffs. A single-point VaR number can look reassuring while hiding a portfolio that behaves disastrously under one particular, entirely plausible, combination of shocks.
When should you prefer stress tests or EVT over standard parametric VaR? Broadly, whenever the portfolio has significant leverage, illiquid positions, or exposure to instruments with non-linear payoffs (options, structured debt, complex JV equity stacks). Parametric VaR handles smooth, liquid, roughly linear portfolios reasonably well. It handles almost nothing else convincingly.
What historical events reveal about tail risk
2008 global financial crisis. What broke wasn’t a single asset class, it was the assumption that mortgage-backed securities across different regions and tranches were meaningfully diversified from one another. They weren’t. When US housing turned, correlated defaults cascaded through leveraged institutions, and counterparty risk, an often-overlooked component of tail exposure, brought down firms that weren’t even directly exposed to the underlying mortgages. The lesson for portfolio design: leverage doesn’t just amplify ordinary losses, it turns correlated tail events into solvency events.
March 2020 COVID sell-off. Equity markets fell roughly a third in weeks, an unusually compressed timeframe for a drawdown of that size. What made it distinctive was the speed, not just the depth. Traditional hedges that rely on having time to adjust positions were tested severely, and many “diversified” portfolios discovered that bonds, equities, and even gold moved together during the worst days of the panic, as everyone scrambled for cash simultaneously. The lesson: liquidity itself becomes the scarce resource in a genuine tail event, and hedges that depend on orderly markets can fail exactly when needed most.
2010 flash crash. In minutes rather than days, US equity indices plunged and then largely recovered, driven by a combination of automated trading and evaporating liquidity in order books. It wasn’t a fundamental economic shock, it was a market microstructure failure, and it demonstrated that tail events don’t require a genuine crisis narrative. Sometimes the plumbing itself is the risk. The lesson: intraday and execution risk deserve a place in tail-risk thinking, not just macro scenario analysis.
- 2008: correlated leverage turned a housing downturn into a systemic banking crisis.
- 2020: speed of decline overwhelmed hedges calibrated for slower-moving drawdowns.
- 2010: market structure itself, not fundamentals, produced an extreme intraday move.
What are the main tail-risk hedging strategies?
Direct option-based hedges are the most straightforward conceptually. Buying out-of-the-money (OTM) put options on an equity index gives a portfolio a payoff that kicks in once markets fall past a chosen strike price, functioning much like an insurance policy with a deductible. A protective collar refines this by selling an OTM call to partly fund the put purchase, trading away some upside participation in exchange for cheaper downside protection.
Volatility instruments take a different route. VIX futures and volatility exchange-traded products tend to spike when equity markets fall, because implied volatility itself rises sharply during panics. Practical hedging analysis notes that these instruments can produce large payoffs precisely during severe drawdowns, but they carry persistent roll costs in calm periods, since futures curves in volatility markets are usually in contango, meaning each roll into a new contract tends to lose value.
Systematic trend-following is a structurally different approach again. Rather than paying an explicit premium, trend-following strategies aim to detect and ride sustained downward moves, shorting or reducing exposure as a trend develops. It’s imperfect and slower to react than options, but it avoids the constant premium drag that direct hedges carry.
Then there are allocation-level structural choices that don’t involve derivatives at all: holding a lower equity weight, genuine diversification across uncorrelated return drivers, and maintaining cash or capital buffers. These are blunter tools but they don’t decay in value the way an unused option does.
Example: rolled OTM index put programme. A common institutional approach involves buying puts roughly 5 to 10% out of the money, with three-month expiries, rolling the position forward each quarter. The strike selection balances cost against the depth of protection, closer strikes cost more but trigger earlier. The roll mechanic means you’re continually paying a fresh premium, so the cumulative cost over several calm years can be substantial, even though any single quarter’s cost looks modest.
| Hedge type | Strengths | Weaknesses |
|---|---|---|
| Options (OTM puts, collars) | Defined payoff structure, clear strike-based protection | Ongoing premium cost, requires active roll management |
| Volatility instruments | Large payoffs in acute equity stress, fast-reacting | Contango-driven roll costs, poor standalone returns in calm markets |
| Trend-following | No explicit premium, can profit from sustained declines | Slower to react, whipsaw losses in choppy markets |
| Allocation-based (cash, diversification, lower equity weight) | No decay, simple to govern | Blunt instrument, opportunity cost in rising markets |
Every one of these carries basis risk, meaning the hedge instrument doesn’t perfectly track the actual exposure you’re protecting. Timing risk means the hedge might not be in place, or sized correctly, when the shock actually arrives. Liquidity can vanish in the very instruments you’re relying on to exit a hedge profitably. And path dependence means the sequence of market moves, not just the eventual outcome, determines whether a hedge programme actually pays off.
Pro Tip: Never judge a hedging programme by a single quarter’s cost or payoff. Look at rolling three to five year performance across both calm and stressed periods, because the entire value proposition of a tail hedge only becomes visible across a full cycle.
What does a tail-risk fund actually do?
A tail-risk fund, sometimes packaged as an ETF, is essentially structured insurance. It typically holds a core allocation designed to behave normally in calm markets, alongside an options-driven overlay, often built around OTM puts, designed to pay off disproportionately when equities fall sharply. Morningstar’s analysis is blunt about the trade-off: these products tend to underperform in normal market conditions because of the continuous cost of the insurance they’re carrying. That underperformance isn’t a flaw, it’s the entire mechanism working as designed.
Before allocating to any tail-risk product, a practical checklist is worth working through:
- What exactly is the strategy? Is it options-based, volatility-based, trend-following, or some blend, and does the manager describe the mechanism clearly or hide behind vague language?
- What’s the expected drag in calm markets, and does the manager quantify it honestly rather than only showcasing crisis-period performance?
- How transparent is the fund about position sizing, strike selection, and roll timing?
- What’s the liquidity profile, both of the fund itself and of the instruments it holds?
- What counterparty exposure exists, particularly for over-the-counter derivative positions rather than exchange-traded ones? FINRA’s guidance on dealer disclosure is a useful reference point here.
- How did the strategy actually behave during 2008, 2020, or 2010, not in a back-tested simulation but in live performance?
- What governance exists around fees, rebalancing, and who has authority to change the hedge sizing?
Product forms vary. Listed ETFs offer daily liquidity and transparency but limited customisation. Actively managed funds can tailor the strategy more precisely but usually charge higher fees and offer less transparency into daily positioning. Bespoke hedging mandates, more common among institutional investors and family offices, allow full customisation of strike selection, notional sizing, and counterparty choice, at the cost of far greater complexity and minimum scale requirements.
How much tail-risk hedging should a portfolio carry?
There’s no universal percentage that works for every investor, and anyone offering one is oversimplifying. The more useful approach is iterative: run stress tests against specific scenarios (a 30% equity drawdown, a credit spread blowout, a property market correction relevant to your holdings) and size the hedge to bring the worst-case outcome within your actual risk budget, not an arbitrary target.
- Start with your risk budget: what loss would genuinely threaten your capital base or your ability to meet obligations?
- Stress test the unhedged portfolio against several distinct scenario types, not just a generic “market down 20%” case.
- Size the hedge to close the gap between the stressed outcome and your risk budget, rather than buying a fixed percentage because it sounds prudent.
- Reassess the sizing at least annually, and whenever the underlying portfolio composition changes materially.
Goldman Sachs Asset Management’s research makes a point worth repeating here: tail hedging, correctly sized and governed, can permit a larger equity or risk allocation elsewhere in the portfolio, because trimming the left tail changes the entire risk calculus, not just the hedge line item itself.
Monitoring shouldn’t stop once the hedge is in place. Track the hit rate (how often the hedge actually pays out relative to genuine stress episodes), the correlation between hedge payoffs and portfolio drawdowns, and the liquidity of the hedge instruments themselves under stressed conditions, not just calm ones. Counterparty exposure needs regular review too, particularly for bespoke or over-the-counter structures.
- Mandate language should specify who can adjust hedge sizing and under what triggers.
- Rebalancing rules need to be set in advance, ideally before any crisis, not negotiated mid-panic.
- Reporting frequency should increase during periods of elevated volatility, not stay fixed at a quarterly default.
- Governance should include a clear escalation path if the hedge underperforms its expected behaviour during a real stress event.
Developers and investors working with structured debt should think about this alongside their financing choices. Loan covenants, refinancing timelines, and leverage levels all interact with tail-risk exposure, a point covered in more depth in this guide to capital raising best practices for UK property developers.
What does tail-risk hedging actually cost?
The direct costs are the easiest to quantify and the ones most often underestimated in advance. Option premiums are paid whether or not the market falls, and rolled programmes mean this cost recurs every quarter or month, compounding over years. Volatility instruments carry roll yield costs driven by contango in futures curves. Actively managed tail-risk funds layer management fees on top of the strategy’s own inherent drag.
Indirect costs matter just as much and are harder to put a number on. There’s the opportunity cost of capital tied up in a hedge that, most years, simply expires worthless. There’s added complexity in the portfolio, more moving parts to monitor, more judgement calls about roll timing and strike selection. Liquidity constraints can bite exactly when you’d want to unwind or adjust the hedge. Counterparty risk lingers in any position that isn’t exchange-cleared.
The behavioural trap is the most damaging cost of all, and it isn’t in any fee schedule. After several years of premium drag with no payoff, the natural human instinct is to cut the hedge, right before the environment that justified it in the first place. Morningstar’s framing of these products as catastrophe insurance is useful precisely because nobody cancels their home insurance the year before the fire. Yet portfolios abandon tail hedges after long calm stretches with striking regularity.
Pro Tip: Write the hedge sizing rule down before you need it, and give a governance committee, not a single portfolio manager under pressure, authority to change it. The single biggest reason tail hedges fail to add value isn’t poor construction, it’s investors abandoning them at exactly the wrong moment.
Why hedges should enable risk, not just reduce it
Most conversations about tail risk treat hedging as a defensive afterthought, something bolted onto a portfolio once the “real” investment decisions are made. That framing gets it backwards. The more useful way to think about a tail hedge is as a structural decision that changes how much risk you can responsibly take everywhere else.
If a reliable hedge genuinely trims the left tail, that changes the entire risk calculus for the rest of the portfolio. A developer or investor who knows a severe market shock won’t wipe out the whole position can justify carrying more leverage, or a larger equity stake, on individual projects, provided the hedge is sized honestly and governed properly rather than sized to look reassuring on a report. That’s a materially different mindset from buying protection out of anxiety after a bad quarter.
Governance and monitoring, not clever strike selection or the newest volatility product, are what actually determine whether hedging adds long-term value. A well-designed hedge with weak governance gets abandoned at the worst possible moment. A mediocre hedge with strong governance, clear sizing rules, and disciplined rebalancing tends to outperform expectations simply because it survives long enough to work. Anyone advising on structured debt and complex property finance sees this pattern repeat: the deals that survive a downturn are rarely the ones with the cleverest hedge, they’re the ones where somebody enforced the plan when it was uncomfortable to do so.
James William & Co Capital works with developers and investors on exactly this kind of structural thinking, treating financing choices as inseparable from the risk profiles they create.
How James William & Co Capital supports tail-risk planning
Getting the sizing, structure, and counterparty selection right on a tail-risk programme is a specialist job, and it’s one where a broker who understands both the derivative side and the underlying property or business exposure earns their fee. James William & Co Capital works as a capital concierge for developers, investors, and high-net-worth clients precisely because these decisions rarely sit neatly inside one silo, financing structure and risk management need to be designed together, not bolted on afterwards.
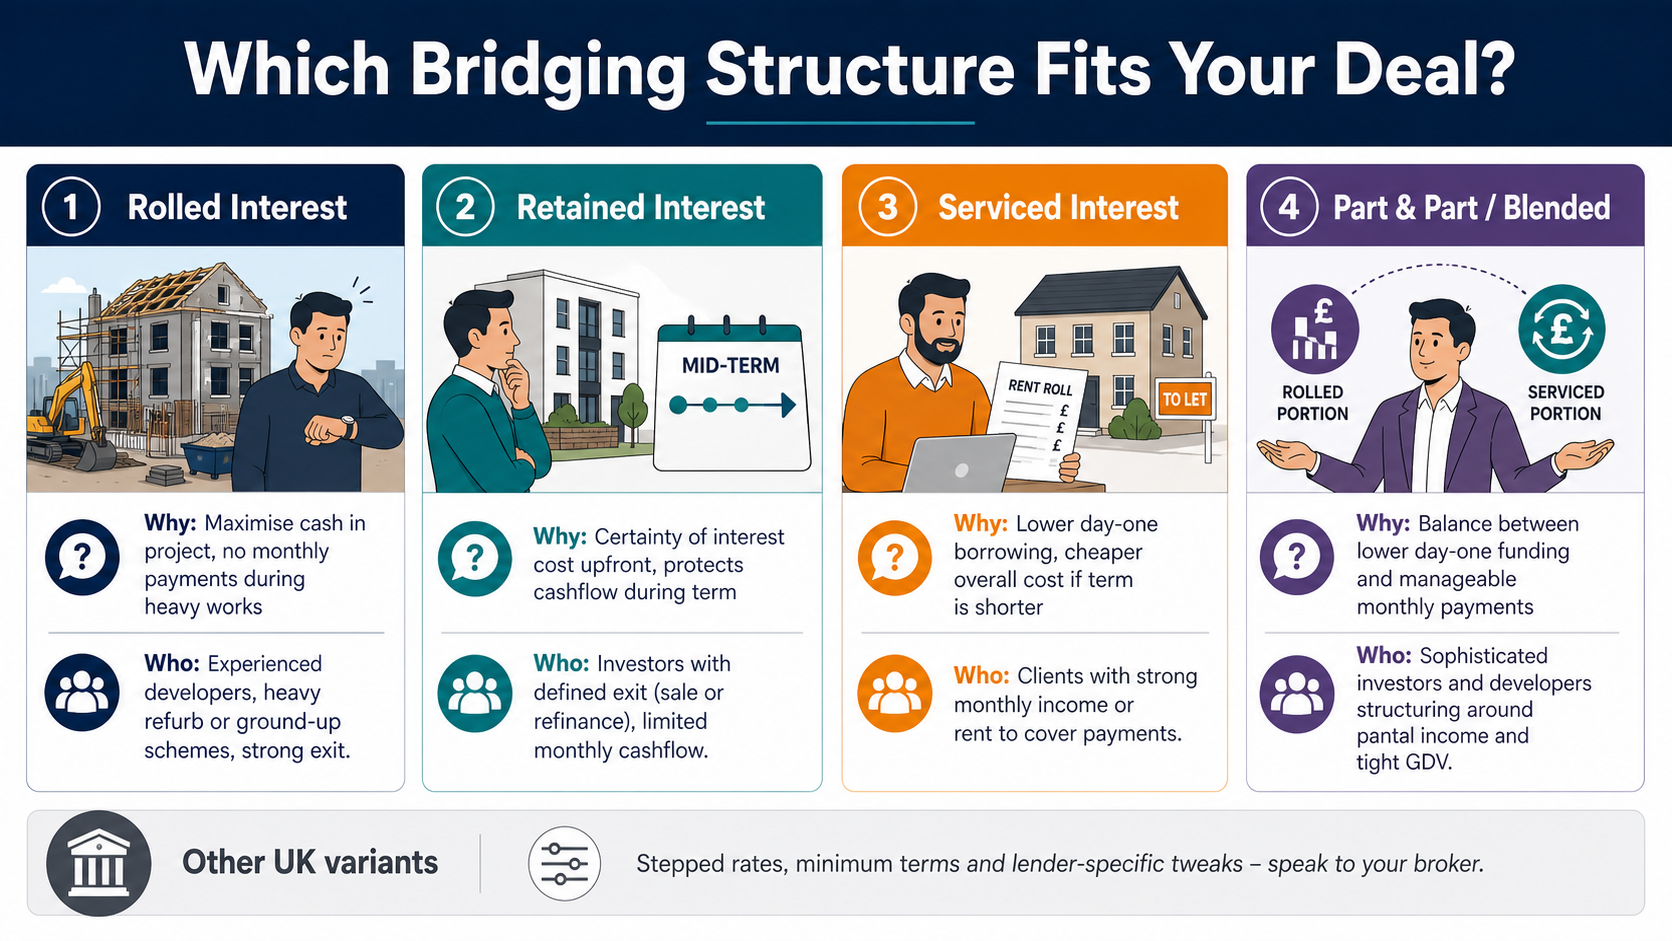
That means bespoke sizing conversations rather than off-the-shelf percentages, counterparty due diligence on the lenders and funds involved in a debt stack, execution support when timing matters, and governance frameworks that survive contact with an actual crisis rather than looking good on paper. For clients running complex refinances, ground-up developments, or multi-layered debt structures, that can mean stress testing a portfolio against a genuine downside scenario before the loan is even drawn, not after. The firm’s work structuring bridging finance, mezzanine debt, and JV equity, documented across various case studies, reflects exactly this kind of scenario-first thinking.
If you’re weighing how a financing structure might behave under stress, or want a second opinion on counterparty exposure within a debt stack, a diagnostic conversation with James William & Co Capital is a sensible first step. For those specifically weighing hedging alongside a wider portfolio, the firm’s wealth planning service extends that thinking beyond individual property transactions.
Sources
This article is general information, not a substitute for advice from a qualified financial advisor. Consult a qualified financial professional about your own circumstances before acting on anything here.
FAQ
How Do You Hedge Against Tail Risk?
The main routes are OTM put options, protective collars, volatility instruments such as VIX futures, systematic trend-following, and structural choices like lower equity weight or larger cash buffers, each with a different cost and reliability profile.
What Is a Tail-Risk Fund?
A tail-risk fund holds a core allocation alongside an options or volatility-driven overlay designed to pay off during sharp market falls, typically underperforming in calm markets because of the ongoing cost of that protection.
What Does Right Tail Risk Mean?
Right tail risk refers to unusually large positive outcomes rather than losses; most professional risk management focuses almost entirely on the left tail because catastrophic losses threaten solvency in a way extreme gains never do.
How Much of a Portfolio Should Go Into Tail-Risk Hedging?
There’s no fixed percentage that suits every portfolio; sizing should come from stress-testing specific scenarios against your actual risk budget rather than applying an arbitrary rule of thumb.
Can Diversification Alone Protect Against Tail Risk?
Not reliably, because correlations between asset classes tend to rise sharply during genuine market stress, which is exactly when diversification is meant to provide protection.
Recommended
Related Topics
Speak to a specialist
Discuss your finance with James directly
Whole-of-market specialist finance — bridging, development, commercial and residential. No call centres, no obligation. James reviews every enquiry personally.
New to specialist finance? How unbiased broker advice works · Deals we have completed
Explore Related Finance